
Quantumlike Chaos in the Frequency Distributions
of the Bases A, C, G, T in Drosophila DNA
A. M. Selvam
Deputy Director (Retired)
Indian Institute of Tropical Meteorology,
Pune 411 008, India
Abstract
The number frequency of occurrence of each
of the bases A, C, G, T in successive block lengths of 50 bases of Drosophila
DNA base sequence exhibit selfsimilar fractal fluctuations generic
to dynamical systems in nature. Continuous periodogram power spectral analyses
of the frequency distribution of bases A, C, G, T in Drosophila DNA base
sequence show that the power spectra follow the universal inverse power-law
form of the statistical normal distribution. Inverse power-law form for
power spectra of space-time fluctuations is generic to dynamical systems
in nature and is identified as self-organized criticality. The author
has developed a general systems theory which provides universal quantification
for observed self-organized criticality in terms of the statistical
normal distribution. The long-range correlations intrinsic to observed
self-organized criticality is a signature of quantumlike chaos
in macro-scale dynamical systems. The results of power spectral analyses
are in agreement with the following theoretical predictions. (1) The apparently
irregular (chaotic) fluctuations self-organize to form an overall logarithmic
spiral trajectory with the quasiperiodic
Penrose tiling pattern
for the internal structure. (2) Conventional power spectral analyses resolves
such a spiral trajectory as an eddy continuum with embedded dominant wavebands
with progressive increase in phase and bandwidth. The dominant peak periodicities
are functions of the golden mean.
The important result
of the present study is that the observed fractal frequency distributions
of the bases A, C, G, T of Drosophila DNA base sequence exhibit long-range
spatial correlations or self-organized criticality generic to dynamical
systems in nature. Therefore, artificial modification of the DNA base sequence
structure at any location may have significant noticeable effect on the
function of the DNA molecule as a whole. Further, the presence of non-coding
introns
may not be redundant, but serve to organize the effective functioning of
the coding exons in the DNA molecule as a complete unit.
1. Introduction
1.1 The DNA molecule and
heredity
Heredity in living organisms is determined
by a long complex chemical molecule called DNA (deoxyribonucleic acid).
The
units of heredity, the genes are parts of the DNA molecule situated along
the length of the chromosomes inside the nucleus of the cell. A simplified
picture of the molecule of DNA may be visualised to consist of two long
backbones with projections sticking out from them at right angles rather
like a ladder with its two upright sides and its rungs. The backbones are
made up of two simple chemicals arranged alternately - sugar - phosphate
- sugar - phosphate - all along the way. The projections
are the four units or 'letters' of the code; they are four chemicals bases
called guanine, cytosine, adenine and thymine
- G, C, A, T. These four bases are arranged in a specific sequence which
constitutes the genetic code. The DNA molecule actually consists not of
a single thread, but of two helical threads wound around each other - a
double helix. The two DNA chains run in opposite directions and are
coiled around each other with the bases facing one another in pairs. Only
specific pairs of bases can be linked together, T always pairs with A,
and G with C (Claire, 1964; Bates and Maxwell, 1993). The amount of A is
the same as the amount of T, while the amount of G is the same as the amount
of C. These are now known as Chargaff ratios (Gribbin, 1985; Alcamo, 2001).
What distinguishes
one type of cell from another and one organism from another is the protein
which it contains. And it is DNA which dictates to the cell how many and
what types of protein it shall make. Twenty different chemicals called
amino
acids in different sets of combinations form the proteins. The sequence
of bases along each DNA molecule in the chromosome determines the sequence
of amino acids along each of the proteins. It takes a sequence of
3
bases, the codon, to identify one amino acid. The order
in which these bases recur within a particular gene in the helix corresponds
to the information needed to build that gene's particular protein (Claire,
1964; Leone, 1992; Ball, 2000).
The genes of higher
organisms are seldom 'recorded' in the chromosomes intact, but are scattered
in fragmentary fashion along a stretch of DNA, broken up by chunks of DNA
which seem at first sight to carry no message at all. All the useless or
"junk" DNA, the intervening sequences are known as introns.
The pieces of DNA carrying genetic code are called exons. The codons,
64
in number are distributed over the coding parts of the DNA sequences. It
is well known that the coding regions are translated into proteins. The
non-coding parts are presumed important in regulatory and promotional activities.
The biologically meaningful structures in non-coding regions are not known
(Gribbin, 1985; Guharay et al. 2000; Clark, 2001; Som et
al., 2001). Understanding genetic defects will make it easier to
treat them (Watson, 1997).
Historically, Watson
and Crick (1953) put together all the experimental data concerning DNA
and decided that the only structure that fitted all the facts was the double
helix and postulated that DNA is composed of two ribbonlike "backbones"
composed of alternating deoxyribose and phosphate molecules. They surmised
that nucleotides extend out from the backbone chains and that the 0.34nm
distance represents the space between successive nucleotides. The X-ray
data showed a distance of 34nm between turns, so they guessed that
ten nucleotides exist per turn. One strand of DNA would only encompass
1nm
width, so they postulated that DNA is composed of two strands to conform
to the 2nm diameter observed in the X-ray diffraction photographs.
Scientists now agree that DNA is arranged as a double helix of two intertwined
chains, with complementary bases (A-T and G-C) opposing each other. Moreover,
the strands run opposite to one another, that is, the strands display the
reverse polarity. They are said to be "antiparallel". Given the base sequence
of one chain of DNA, the base sequence of its partner chain is automatically
determined by simply noting which bases are complimentary (adenine-thymine
or cytosine-guanine). Furthermore, the structure provides a mechanism by
which one chain can serve as a template (a model or pattern) for the synthesis
of the other chain (Sambamurty, 1999; Alcamo, 2001). The genomic DNA in
cells must be highly compacted in order to be contained in the required
space. Each chromosome appears to contain a single giant molecule of DNA.
At least three levels of condensation are required to package the 103
to 105 micrometer of DNA in a eukaryotic (higher organism) chromosome
into a metaphase structure a few microns long. The first level of condensation
involves packaging DNA as a supercoil into nucleosomes. This produces 10nm
diameter interphase chromatin fiber. Second level of condensation involves
an additional folding and/or supercoiling of the 10nm nucleosome
fiber to produce the 30nm chromatin fiber. This third level of condensation
appears to involve the segregation of segments of the giant DNA molecules
present in eukaryotic chromosomes into independently supercoiled domains
or loops. The mechanism by which this third level of condensation occurs
is not known (Sambamurty, 1999).
1.2 Long-range correlations
in DNA base sequence
DNA topology is of fundamental importance
for a wide range of biological processes (Bates and Maxwell, 1993). One
big question in DNA research is whether there is some meaning to the order
of the base pairs in DNA. Human DNA has become a fascinating topic for
physicists to study. One reason for this fascination is the fact that when
living cells divide the DNA is replicated exactly. This is interesting
because approximately 95% of human DNA is called "junk" even by
biologists who specialise in DNA. One practical task for physicists is
simply to identify which sequences within the molecule are the coding sequences.
Another scientific interest is to discover why the "junk" DNA is there
in the first place. Almost everything in biology has a purpose that, in
principle, is discoverable (Stanley, 2000). The study of statistical patterns
in DNA sequences is important as it may improve our understanding of the
organization and evolution of life on the genomic level. Recent studies
indicate that the DNA sequence of letters A, C, G and T does have a 1/fa
frequency spectrum. It is possible, therefore, that the sequences have
long-range order and underlying grammar rules. The opinion on this issue
remains divided (Som et al., 2001 and all references therein).
The findings of long-range correlations in DNA sequences have attracted
much attention, and attempts have been made to relate those findings to
known biological features such as the presence of triplet periodicities
in protein-coding DNA sequences, the evolution of DNA sequences, the length
distribution of protein-coding regions, or the expansion of simple sequence
repeats (Holste et al., 2001).
A summary of recent
results relating to long-range correlation (LRC) in DNA sequences is given
in the following. Based on spectral analyses, Li et al. found
( Li, 1992; Li and Kaneko, 1992; Li, Marr and Kaneko,
1994) that the frequency spectrum of a DNA sequence containing mostly introns
shows 1/fa
behavior, which evidences the presence of long-range correlations. The
correlation properties of coding and noncoding DNA sequences were first
studied by Peng et al. (1992) in their fractal landscape
or DNA walk model. Peng et al. (1992) discovered that
there exists LRC in noncoding DNA sequences while the coding sequences
correspond to a regular random walk. By doing a more detailed analysis
of the same data set, Chatzidimitriou-Dreismann and Larhammar (1993) concluded
that both coding and noncoding sequences exhibit LRC. A subsequent work
by Prabhu and Claverie (1992) also substantially corroborates these results.
Buldyrev et al. (1995) showed the LRC appears mainly in noncoding
DNA using all the DNA sequences available. Alternatively, Voss (1992; 1994),
based on equal-symbol correlation, showed a power-law behavior for the
sequences studied regardless of the percent of intron contents.
Havlin et al. (1995) state that DNA sequence in genes containing
noncoding regions is correlated, and that the correlation is remarkably
long range--indeed, base pairs thousands of base pairs distant are correlated.
Such long-range correlations are not found in the coding regions
of the gene. Havlin et al. (1995) suggest that noncoding regions
in plants and invertebrates may display a smaller entropy and larger redundancy
than coding regions, further supporting the possibility that noncoding
regions of DNA may carry biological information. Investigations based on
different models seem to suggest different results, as they all look into
only a certain aspect of the entire DNA sequence. It is therefore important
to investigate the degree of correlations in a model-independent way. Hence
one may ignore the composition of the four kinds of bases in coding and
noncoding segments and only consider the rough structure of the complete
genome or long DNA sequences. Yu et al. (2000) proposed a time series
model based on the global structure of the complete genome and considered
three kinds of length sequences. The values of the exponents from
these three kinds of length sequences of bacteria indicate that the long-range
correlations exist in most of these sequences (Yu et al.,
2000 and all the references contained therein). Recently from a systematic
analysis of human exons, coding sequences (CDS) and
introns,
Audit
et al. (2001) have found that power law correlations
(PLC) are not only present in noncoding sequences but also in coding regions
somehow hidden in their inner codon structure. If it is now well admitted
that long-range correlations do exist in genomic sequence, their biological
interpretation is still a continuing debate (Audit et al.,
2001 and all references therein).
The
long-range correlation does not necessarily imply a deviation from Gaussianity.
For example, the fractional Brownian motion which has Gaussian statistics
shows an inverse power law spectrum. According to Allegrini et al.
(1996, based on Levy’s statistics), long-range correlations would imply
a strong deviation from Gaussian statistics while the investigation of
Arneodo et al. (1995) yields an important conclusion that
the DNA statistics are essentially Gaussian (Mohanty and Narayana Rao,
2000).
In visualizing very
long DNA sequences, including the complete genomes of several bacteria,
yeast and segments of human genes, it is seen that fractal-like
patterns underly these biological objects of prominent importance. The
method used to visualize genomes of organisms may well be used as
a convenient tool to trace, e.g., evolutionary relatedness of species (Hao
et
al., 2000). Stanley, Amaral et al. (1996) and Stanley,
Afanasyev
et al. (1996) discuss examples of complex systems composed
of many interacting subsystems which display nontrivial long-range correlations
or long-term "memory". The statistical properties of DNA sequences, heartbeat
intervals, brain plaque in Alzheimer brains, and fluctuations in economics
have the common feature that the guiding principle of scale invariance
and universality appear to be relevant (Stanley, 2000).
1.3 Nonlinear dynamics and
chaos
Irregular (nonlinear) fluctuations on all
scales of space and time are generic to dynamical systems in nature such
as fluid flows, atmospheric weather patterns, heart beat patterns, stock
market fluctuations, etc. Mandelbrot (1977) coined the name fractal
for the non-Euclidean geometry of such fluctuations which have fractional
dimension, for example, the rise and susequent fall with time of the Dow
Jones Index or rainfall traces a zig-zag line in a two-dimensional
plane and therefore has a fractal dimension greater than one but
less than two. Mathematical models of dynamical systems are nonlinear and
finite precision computer realisations exhibit sensitive dependence on
initial conditions resulting in chaotic solutions, identified as deterministic
chaos. Nonlinear dynamics and chaos is now (since 1980s) an
area of intensive research in all branches of science (Gleick, 1987). The
fractal
fluctuations exhibit scale invariance or selfsimilarity manifested as the
widely documented (Bak, Tang, Wiesenfeld, 1988; Bak and Chen, 1989; 1991;
Schroeder, 1991; Stanley, 1995; Buchanan,1997) inverse power law form for
power spectra of space-time fluctuations identified as self-organized
criticality by Bak et al. (1987). The power-law is a distinctive
experimental signature seen in a wide variety of complex systems. In economy
it goes by the name fat tails, in physics it is referred to as critical
fluctuations, in computer science and biology it is the edge of
chaos, and in demographics it is called Zipf's law (Newman,
2000). Power-law scaling is not new to economics. The power-law distribution
of wealth discovered by Vilfredo Pareto (1848-1923) in the 19th
century (Eatwell, Milgate and Newman, 1991) predates any power-laws in
physics (Farmer, 1999). One of the oldest scaling laws in geophysics
is the Omori law (Omori, 1895). It describes the temporal distribution
of the number of aftershocks which occur after a larger earthquake (i.e.,
mainshock) by a scaling relationship.The other basic empirical seismological
law, the Gutenberg-Richter law (Gutenberg and Richter, 1944) is
also a scaling relationship, and relates intensity to its probability of
occurrence (Hooge et. al., 1994). Time series analyses of global
market economy also exhibits power-law behaviour ( Bak et al., 1992;
Mantegna and Stanley, 1995; Sornette et al., 1995; Chen, 1996a,b;
Stanley, Amaral, Buldyrev, Havlin et al., 1996; Feigenbaum and Freund,
1997a,b; Gopikrishnan
et al., 1999; Plerou
et al., 1999;
Stanley et al., 2000; Feigenbaum, 2001a,b) with possible
multifractal
structure ( Farmer, 1999 ) and has suggested an analogy to fluid turbulence
(Ghashghaie et al., 1996; Arneodo et al., 1998). Sornette
et
al. (1995) conclude that the observed power-law represents
structures similar to 'Elliott waves' of technical analysis first
introduced in the 1930s. It describes the time series of a stock price
as made of different
waves, these waves are in relation
to each other through the Fibonacci series. Sornette
et al.
(1995) speculate that 'Elliott waves' could be a signature of an
underlying critical structure of the stock market. Incidentally the
Fibonacci
series represent a fractal tree-like branching network of selfsimilar
structures (Stewart, 1992). The commonly found shapes in nature are the
helix and the dodecahedron (Muller and Beugholt,1996) which are signatures
of selfsimilarity underlying
Fibonacci numbers. The general systems
theory presented in this paper shows (Section 2) that Fibonacci
series underlies fractal fluctuations on all space-time scales.
Historically,
basic similarity in the branching (fractal) form underlying the
individual leaf and the tree as a whole was identified more than three
centuries ago in botany (Arber,1950). The branching (bifurcating) structure
of roots, shoots, veins on leaves of plants, etc., have similarity in form
to branched lighting strokes, tributaries of rivers, physiological networks
of blood vessels, nerves and ducts in lungs, heart, liver, kidney, brain
,etc. (Freeman, 1987; 1990; Goldberger et al., 1990; Jean, 1994;
). Such seemingly complex network structure is again associated with Fibonacci
numbers seen in the exquisitely ordered beautiful patterns in flowers and
arrangement of leaves in the plant kingdom (Jean, 1994; Stewart, 1995).
The identification of physical mechanism for the spontaneous generation
of mathematically precise, robust spatial pattern formation in plants will
have direct applications in all other areas of science (Mary Selvam, 1998).
The importance of scaling concepts were recognized nearly a century ago
in biology and botany where the dependence of a property
y on size
x
is usually expressed by the allometric equation
y=axb
where a and b are constants (Thompson,1963; Strathmann, 1990;
Jean, 1994; Stanley, Amaral, Buldyrev, Goldberger et al.,
1996). This type of scaling implies a hierarchy of substructures and was
used by D’Arcy Thompson for scaling anatomical structures, for example,
how proportions tend to vary as an animal grows in size (West, 1990a).
D’Arcy
Thompson (1963, first published in 1917) in his book On Growth
and Form has dealt extensively with similitude principle for biological
modelling. Rapid advances have been made in recent years in the fields
of biology and medicine in the application of scaling (fractal)
concepts for description and quantification of physiological systems and
their functions (Goldberger, Rigney and West, 1990; West, 1990a,b; Deering
and West,1992; Skinner,1994; Stanley, Amaral, Buldyrev, Goldberger
et.
al.,
1996). In meteorological theory, the concept of selfsimilar fluctuations
was identified and introduced in the description of turbulent
flows by Richardson (1965, originally published in 1922; see also Richardson,
1960), Kolmogorov (1941,1962), Mandelbrot (1975) (Kadanoff 1996) and others
(see Monin and Yaglom ,1975 for a review).
Self-organized criticality
implies long-range space-time correlations or non-local connections in
the spatially extended dynamical system. The physics underlying self-organized
criticality is not yet identified. Prediction of the future evolution
of the dynamical system requires precise quantification of the observed
self-organized
criticality. The author has developed a general systems theory
(Capra, 1996 ) which predicts the observed self-organized criticality
as a signature of quantumlike chaos in the macro-scale dynamical system
(Mary Selvam, 1990; Mary Selvam, Pethkar and Kulkarni, 1992; Selvam and
Fadnavis, 1998). The model also provides universal and unique quantification
for the observed
self-organized criticality in terms of the statistical
normal distribution.
Continuous periodogram power
spectral analyses of the frequency distribution of bases A, C, G, T in
Drosophila DNA base sequence agree with model prediction, namely, the power
spectra follow the universal inverse power law form of the statistical
normal distribution. The geometrical distribution of the DNA bases therefore
exhibit self-organized criticality which is a signature of quantumlike
chaos. Earlier studies by the author have identified quantumlike chaos
exhibited by dynamical systems underlying the observed fractal fluctuations
of the following data sets: (1) time series of meteorological parameters
(Mary Selvam, Pethkar and Kulkarni,1992; Selvam and Joshi, 1995; Selvam
et
al.,1996; Selvam and Fadnavis, 1998). (2) spacing intervals of
adjacent prime numbers (Selvam and Suvarna Fadnavis, 1998; Selvam,
2001a) (3) spacing intervals of adjacent non-trivial zeros of the Riemann
zeta function (Selvam, 2001b).
2. A General Systems Theory
for Universal Quantification of Fractal Fluctuations of Dynamical Systems
As mentioned earlier (Section 1.3) power spectral
analyses of fractal space-time fluctuations of dynamical systems
exhibits inverse power-law form, i.e., a selfsimilar eddy continuum. The
cell
dynamical system model (Mary Selvam, 1990; Selvam and Fadnavis, 1998,
and all references contained therein; Selvam, 2001a, b) is a general systems
theory (Capra, 1996) applicable to dynamical systems of all size scales.
The model shows that such an eddy continuum can be visualised as a hierarchy
of successively larger scale eddies enclosing smaller scale eddies. Eddy
or wave is characterised by circulation speed and radius. Large eddies
of root mean square (r.m.s) circulation speed
W and radius
R
form as envelopes enclosing small eddies of r.m.s circulation speed w*
and radius
r such that
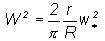
(1)
Since the large
eddy is but the average of the enclosed smaller eddies, the eddy energy
spectrum follows the statistical normal distribution according to the Central
Limit Theorem (Ruhla, 1992). Therefore, the variance represents the
probability densities. Such a result that the additive amplitudes of the
eddies, when squared, represent the probabilities is an observed feature
of the subatomic dynamics of quantum systems such as the electron or photon
(Maddox 1988a, 1993; Rae, 1988). The fractal space-time fluctuations
exhibited by dynamical systems are signatures of quantumlike mechanics.
The cell dynamical system model provides a unique quantification for the
apparently chaotic or unpredictable nature of such fractal fluctuations
( Selvam and Fadnavis, 1998). The model predictions for quantumlike chaos
of dynamical systems are as follows.
(a) The observed fractal fluctuations of dynamical
systems are generated by an overall logarithmic spiral trajectory with
the quasiperiodic Penrose tiling pattern (Nelson, 1986; Selvam and
Fadnavis, 1998) for the internal structure.
(b) Conventional continuous periodogram power spectral
analyses of such spiral trajectories will reveal a continuum of periodicities
with progressive increase in phase.
(c) The broadband power spectrum will have embedded
dominant wave-bands, the bandwidth increasing with period length. The peak
periods (or length scales) En in the dominant
wavebands will be given by the relation
En=Ts(2+t
)t n
(2)
where t
is the golden mean equal to (1+Ö
5)/2 [@ 1.618] and
Ts
, the primary perturbation length scale. Considering the most representative
example of turbulent fluid flows, namely, atmospheric flows, Ghil (1994)
reports that the most striking feature in climate variability on all time
scales is the presence of sharp peaks superimposed on a continuous background.
The model predicted periodicities
(or length scales) in terms of the primary perturbation length scale units
are 2.2,
3.6,
5.8,
9.5,
15.3,
24.8, 40.1,
64.9,
105.0
respectively
for values of n ranging from
-1 to 7. Periodicities (or length
scales) close to model predicted have been reported in weather and climate
variability (Burroughs, 1992; Kane, 1996), prime number distribution
(Selvam, 2001a), Riemann zeta zeros (non-trivial) distribution (Selvam,
2001b).
Sornette
et
al. (1995) also conclude that the observed power law represents
structures similar to 'Elliott waves' of technical analysis first
introduced in the 1930s. It describes the time series of a stock price
as made of different
waves, these waves are in relation
to each other through the Fibonacci series. Sornette
et al.
(1995) speculate that 'Elliott waves' could be a signature of an
underlying critical structure of the stock market.
(d) The length scale ratio r/R also represents
the increment
dq
in phase angle q
(Equation 1 ). Therefore the phase angle q
represents the variance. Hence, when the logarithmic spiral is resolved
as an eddy continuum in conventional spectral analysis, the increment in
wavelength is concomitant with increase in phase (Selvam and Fadnavis,
1998). Such a result that increments in wavelength and phase angle are
related is observed in quantum systems and has been named 'Berry's phase'
(Berry 1988; Maddox 1988b; Simon et al., 1988; Anandan, 1992). The
relationship of angular turning of the spiral to intensity of fluctuations
is seen in the tight coiling of the hurricane spiral cloud systems.
The overall logarithmic spiral flow structure is
given by the relation
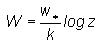
(3)
where the constant k is the steady
state fractional volume dilution of large eddy by inherent turbulent eddy
fluctuations . The constant k is equal to 1/t2(@0.382)
and is identified as the universal constant for deterministic chaos
in fluid flows (Selvam and Fadnavis, 1998).The steady state emergence of
fractal
structures is therefore equal to
1/k @2.62
(4)
The model predicted logarithmic
wind profile relationship such as Equation 3 is a long-established (observational)
feature of atmospheric flows in the atmospheric boundary layer, the constant
k,
called the Von Karman ’s constant has the value equal to
0.38
as determined from observations (Wallace and Hobbs, 1977).
In Equation 3, W
represents the standard deviation of eddy fluctuations, since W
is computed as the instantaneous r.m.s. ( root mean square) eddy perturbation
amplitude with reference to the earlier step of eddy growth. For two successive
stages of eddy growth starting from primary perturbation w*
the ratio of the standard deviations Wn+1 and
Wn
is given from Equation 3 as (n+1)/n. Denoting by s
the standard deviation of eddy fluctuations at the reference level (n=1)
, the standard deviations of eddy fluctuations for successive stages of
eddy growth are given as integer multiple of s
, i.e., s,
2s
, 3s
, etc., and correspond respectively to
statistical normalized standard deviation
t=0,1,2,3, etc.
(5)
The conventional
power spectrum plotted as the variance versus the frequency in log-log
scale will now represent the eddy probability density on logarithmic scale
versus the standard deviation of the eddy fluctuations on linear scale
since the logarithm of the eddy wavelength represents the standard deviation,
i.e., the r.m.s. value of eddy fluctuations (Equation 3). The r.m.s. value
of eddy fluctuations can be represented in terms of statistical normal
distribution as follows. A normalized standard deviation t=0 corresponds
to cumulative percentage probability density equal to 50 for the
mean value of the distribution. Since the logarithm of the wavelength represents
the r.m.s. value of eddy fluctuations the normalized standard deviation
t
is defined for the eddy energy as
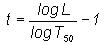
(6)
where L is the wavelength (or period)
and
T50 is the wavelength (or period) up to which the
cumulative percentage contribution to total variance is equal to 50
and t = 0. The variable
logT50 also represents
the mean value for the r.m.s. eddy fluctuations and is consistent with
the concept of the mean level represented by r.m.s. eddy fluctuations.
Spectra of time series of fluctuations of dynamical systems, for example,
meteorological parameters, when plotted as cumulative percentage contribution
to total variance versus
t follow the model predicted universal
spectrum (Selvam and Fadnavis, 1998, and all references therein).
The literature shows many examples of pressure, wind and temperature whose
shapes display a remarkable degree of universality (Canavero and Einaudi,1987).
The periodicities (or length scales)
T50
and T95 up to which the cumulative percentage contribution
to total variances are respectively equal to 50 and 95 are
computed from model concepts as follows.
The power spectrum, when plotted
as normalised standard deviation t versus cumulative percentage
contribution to total variance represents the statistical normal distribution
(Equation 6), i.e., the variance represents the probability density. The
normalised standard deviation values t corresponding to cumulative
percentage probability densities P equal to
50 and 95
respectively are equal to 0 and 2 from statistical normal
distribution characteristics. Since t represents the eddy growth
step n (Equation 5) the dominant periodicities (or length scales)
T50
and T95 up to which the cumulative percentage contribution
to total variance are respectively equal to 50 and 95 are
obtained from Equation 2 for corresponding values of
n equal to
0
and 2. In the present study of fractal fluctuations of frequency
distribution of Drosophila DNA bases A, C, G, T, the primary perturbation
length scale Ts is equal to unit length segment
of 50 bases and T50 and T95 are obtained
as
T50 = (2+t
)t0 @
3.6 unit length segment of 50 bases
(7)
T95 = (2+t
)t2 @
9.5 unit length segment of 50 bases
(8)
The above model
predictions are applicable to all real world and computed model dynamical
systems. Continuous periodogram power spectral analyses of number frequency
(per 50 bases) of occurrence of bases A, C, G, T in Drosophila DNA base
sequence at different locations along its length give results in agreement
with the above model predictions.
3. Data and Analysis
The Drosophila DNA base sequence was obtained
from Berkeley Drosophila Genome Project (BGDP Resources at http://www.fruitfly.org/index.html.
The data set used for the study corresponds to the file NA_ARMS~1 with
the title : >2L, 28-11-2001.1 (22207800 bases) segment 1 of 1 for arm 2L
on wed Nov 28 00: 30 : 01 PST 2001 (http://www.fruitfly.org/sequence/sequence_db/na_arms.dros.
RELEASE 2.9) finished sequence for 2L. The first 225000
bases were used to give 50 data sets each of length 4500
bases. The number of times that each of the bases A, C, G, T occur in successive
blocks of 50 bases was determined for each data set of 4500
bases. Each data set of 4500 bases then gives 4 groups of
90
frequency sequence values corresponding respectively to the four bases
A, C, G, T.
3.1 Fractal nature of frequency
distribution of Drosophila DNA base (A, C, G, or T) sequence
A representative sample for the frequency
of occurrence of base A in successive blocks of length 50 bases
is plotted in Figure 1 for 10, 100, 1000 and
4500
segments for the total sequence consisting of 225000 bases
used in the study. The frequency distribution shows irregular or
fractal
fluctuations for all the segment length scales. The irregular fluctuations
may be visualised to result from the superimposition of an ensemble of
eddies (wavelengths).
Figure 1: Representative example for fractal
fluctuations exhibited by frequency distribution of base A in 10 to 4500
data sets
3.2 The frequency distributions
of DNA bases A, C, G, T and the statistical normal distribution
The frequency distribution of bases A, C,
G, T follow
statistical normal distribution (Selvam and Suvarna
Fadnavis, 2001) as described in the following. Each data set consists of
the frequency distribution Xj where
j = 1, 2, ...n
denotes the class interval number, the total number
n equals 90
class intervals and each class interval consists of 50 bases, so
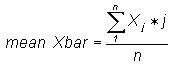
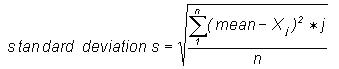
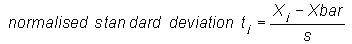
that each data set consists of 4500 bases. The mean Xbar,
standard deviation
s, and normalised standard deviation tj
for each set of frequency distributions was calculated as follows:
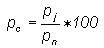
The cumulative frequency
of occurrence pj of base (A, C, G or T) for class intervals
j
= 1, 2, ...n were calculated as

The cumulative percentage
frequency of occurrence pc of base (A, C, G or T) for
class intervals j = 1, 2, ...n were then calculated as
 The graph of cumulative
percentage frequency of occurrence pc versus the corresponding
normalised standard deviation tj follows closely the
statistical normal distribution as shown in Figure 2 for all the
four bases A, C, G, T in the Drosophila DNA sequence. The above result
is consistent with model prediction that the variance spectrum of fractal
fluctuations follows statistical normal distribution as explained in the
following. From Equation (1) , namely
The graph of cumulative
percentage frequency of occurrence pc versus the corresponding
normalised standard deviation tj follows closely the
statistical normal distribution as shown in Figure 2 for all the
four bases A, C, G, T in the Drosophila DNA sequence. The above result
is consistent with model prediction that the variance spectrum of fractal
fluctuations follows statistical normal distribution as explained in the
following. From Equation (1) , namely

it is seen that the length scale ratio
r/R
(or frequency ratio) represents the variance spectrum (W2/w*2)
and therefore the cumulative frequency distribution follows closely the
cumulative normal distribution as shown in Figure 2.
Figure 2: The cumulative percentage frequency
of occurrence of bases A, C, G, T in Drosophila DNA sequence follow closely
the statistical normal distribution
3.3 Continuous periodogram
power spectral analyses
The broadband power spectrum of space-time
fluctuations of dynamical systems can be computed accurately by an elementary,
but very powerful method of analysis developed by Jenkinson (1977) which
provides a quasi-continuous form of the classical periodogram allowing
systematic allocation of the total variance and degrees of freedom of the
data series to logarithmically spaced elements of the frequency range (0.5,
0).
The periodogram is constructed for a fixed set of 10000(m)
wavelengths (or periodicities) Lm which increase geometrically
as Lm=2 exp(Cm) where C=.001 and
m=0, 1, 2,....m
. The data series
Xj for the
n data points
was used. The periodogram estimates the set of Amcos(2pnmS-fm)
where Am, nm
and fm
denote respectively the amplitude, frequency and phase angle for the mth
wavelength (or periodicity) and S is the spatial (or time) interval
in units of 50 bases in the present study of Drosophila DNA base
sequence structure. The cumulative percentage contribution to total variance
was computed starting from the high frequency side of the spectrum. The
wavelength (or period) T50 at which 50% contribution
to total variance occurs is taken as reference and the normalized standard
deviation tm values are computed as (Equation 6)
tm = (log Lm /
log T50)-1
The cumulative percentage
contribution to total variance, the cumulative percentage normalized phase
(normalized with respect to the total phase rotation) and the corresponding
tm
values were computed. The power spectra were plotted as cumulative percentage
contribution to total variance versus the normalized standard deviation
tm
as given above. The wavelength (or period ) Lm
is in units of 50 bases as explained above. Wavelengths (or periodicities)
up to T50 contribute up to
50% of total variance.
The phase spectra were plotted as cumulative percentage normalized (normalized
to total rotation) phase.
3.4 Power spectral analyses:
summary of results
3.4.1 Average variance and
phase spectra
The average variance and phase spectra for
the 50 data sets used in the study along with statistical normal
distribution are shown in Figure 3 for the four bases A, C,
G, T. The 'goodness of fit' (statistical chi-square test) between the variance
spectra and statistical normal distribution is significant at less than
or equal to 5% level for all the variance spectra. The eddy variance
spectra following statistical normal distribution is a signature of quantumlike
chaos (see Section 2) in the frequency distribution sequence of bases A,
C, G, T in Drosophila DNA base sequence arrangement. Phase spectra are
close to the statistical normal distribution, with the 'goodness of fit'
being statistically significant for 42, 36, 48 and
42
percent of data sets respectively for the four bases A, C, G, T. However,
in all the cases, the 'goodness of fit' between variance and phase spectra
are statistically significant (chi-square test) for individual dominant
wavebands, in particular for shorter wavelengths as shown in Figure 6.
Eddy variance spectra following phase spectra is identified as Berry's
phase and is also a signature of quantumlike chaos (see Section 1,
Equation 1). The data sets which do not exhibit Berry's phase are
indicated in Figure 9.
Figure 3: Average
variance (continuous line) and phase (dashed line) spectra for the bases
A, C, G, T for the 50 data sets used in the study. The statistical
normal distribution ( open circles) is also shown.
3.4.2 Dominant wavebands
The power spectra exhibit dominant wavebands
where the normalised variance is equal to or greater than 1. The
dominant peak wavelengths (periodicities) were grouped into class intervals
2
- 3,
3 - 4, 4 - 6,
6 - 12,
12 - 20,
20
- 30, 30 - 50, 50 - 80, 80 - 120 . These class
intervals include the model predicted (Equation 2) dominant peak periodicities
(or length scales) 2.2,
3.6,
5.8, 9.5,
15.3,
24.8,
40.1,
64.9,
105.0,
(in block length segment unit of 50 bases) for values of n
ranging from
-1 to 7. Wavelength class interval-wise percentage
frequency of occurrence of dominant periodicities were computed. In each
class interval, the number of dominant statistically significant (less
than or equal to 5%) periodicities and also the number of dominant
wavebands which exhibit
Berry's phase (variance and phase spectra
are the same) are computed as percentages of the total number of
dominant wavebands in each class interval. The class interval-wise mean
and standard deviation of the above computed frequency distribution of
dominant periodicities, significant dominant periodicities and dominant
periodicities exhibiting
Berry's phase (see Section 2) were then
computed for the four bases A, C, G, T in the Drosophila DNA sequence.
The average class interval-wise distribution of dominant wavelengths (periodicities),
significant dominant wavelengths and dominant wavelengths exhibiting
Berry's
phase respectively are shown in Figures 4, 5 and 6.
Figure 4: Average wavelength class interval-wise
distribution of dominant wavebands for the four bases A, C, G, T in the
50
data sets (a total of 225000 bases) of Drosophila DNA base sequence
used for the study
Figure 5: Average wavelength class interval-wise
distribution of dominant significant wavebands for the four bases A, C,
G, T in the 50 data sets (a total of 225000 bases) of Drosophila
DNA base sequence used for the study
Figure 6: Average wavelength class interval-wise
distribution of dominant wavebands exhibiting Berry's phase
for the four bases A, C, G, T in the 50 data sets (a total of 225000
bases) of Drosophila DNA base sequence used for the study
3.4.3 Peak wavelength versus
bandwidth
The model predicts that the apparently irregular
fractal
fluctuations contibute to the ordered growth of the quasiperiodic
Penrose
tiling pattern with an overall logarithmic spiral trajectory such that
the successive radii lengths follow the Fibonacci mathematical series.
Conventional power spectral analyses resolves such a spiral trajectory
as an eddy continuum with embedded dominant wavebands, the bandwidth
increasing with wavelength. The progressive increase in the radius
of the spiral trajectory generates the eddy bandwidth proportional to the
increment dq
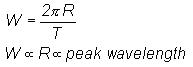
in phase angle equal to r/R. The relative eddy circulation
speed W/w* is directly proportional to the relative
peak wavelength ratio R/r since the eddy circulation speed W=2pR/T
where T is the eddy time period. The relationship between the peak
wavelength and the bandwidth is obtained from Equation (1), namely
Considering eddy growth with overall logarithmic
spiral trajectory

The eddy circulation speed is related to
eddy radius as
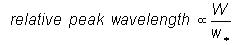
The relative peak wavelength is given in
terms of eddy circulation speed as
From Equation (1) the relationship between
eddy bandwidth and peak wavelength is obtained as
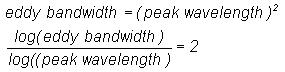
(9)
A log-log plot of peak
wavelength versus bandwidth will be a straight line with a slope
(bandwidth/peak wavelength) equal to 2. A log-log plot of the average
values of bandwidth versus peak wavelength shown in Figure 7 exhibits a
constant slope approximately equal to 2 in agreement with
the above model prediction.

Figure 7: Log-log plot of average values
of bandwidth versus peak wave length for the four bases A, C, G, T. The
slope (bandwidth/peak wavelength) of this graph, also plotted in the above
figure shows an approximately constant value equal to about 2.
The mean and standard deviation of the frequency
distribution for bases A, C, G, T for all the 50 data sets are given
in Figure 8 below. Each data set consists of a sequence of 90 frequency
values corresponding to 90 successive block lengths of 50
bases of Drosophila DNA base sequence.
Figure 8
The periodicities T50 up
to which the cumulative percentage contribution to total variance is equal
to 50 are shown for the bases A, C, G, T for the 50 data
sets in Figure 9. The letter 'N' denotes data set which does not exhibit
Berry's
phase', i.e., the 'goodness of fit' between variance and
phase spectra is not significant.
Figure 9: The periodicities T50
up to which the cumulative percentage contribution to total variance is
equal to 50 are shown for the bases A, C, G, T for the 50
data sets. The letter 'N' denotes data set which does not exhibit Berry's
phase', i.e., the 'goodness of fit' between variance and
phase spectra is not significant. Variance spectra follow normal
distribution for all data sets
4. Results and Discussion
The number frequency of occurrence of each
of the bases A, C, G, T in successive block lengths of 50 bases
of Drosophila DNA base sequence exhibit selfsimilar fractal fluctuations
generic to dynamical systems in nature. The apparently irregular (chaotic)
fractal
fluctuations which characterise the fine-scale geometry of spatial structures
in nature is now an intensive field of study in the new science of nonlinear
dynamics and chaos. The fractal fluctuations are basically a
zig-zag pattern of successive upward and downward swings such as that shown
in Figure 1 for the frequency distribution of bases A, C, G, T for all
data lengths, i.e., number of blocks ranging from
10 to the maximum
4500, a total of 225000 Drosophila DNA base sequence. Such
irregular fluctuations may be visualised to result from the superimposition
of a continuum of eddies. Power spectral analysis is commonly applied to
resolve the component wavelengths and their phases, the wavelengths being
given in terms of the unit block length of 50 bases used for determining
the wavelength distribution. Continuous periodogram power spectral analyses
of the
fractal fluctuations in the frequency distribution of bases
A, C, G, T in Drosophila DNA base sequence follow closely the following
model predictions given in Section 2.
(1) The variance spectra for all the data
sets exhibit the universal inverse power-law form f -a
of the statistical normal distribution (Figures 2 and 3) where f
is the frequency and a,
the spectral slope decreases with increase in wavelength (or decrease in
frequency since frequency is inversely proportional to wavelength) and
approaches 1 for long wavelengths. Inverse power-law form for power
spectra imply long-range spatial correlations in the frequency distributions
of the bases A, C, G, T in Drosophila DNA base sequence structure. Fractal
fluctuations exhibit scale invariance, namely the eddy amplitudes being
related to each other by a simple proportionality factor for the range
of wavelengths for which a
is a constant. The observed frequency distribution exhibits multifractal
structure since the slope a
of the spectrum is not a constant, but decreases with increasing wavelength.
Microscopic-scale quantum systems such as the electron or photon exhibit
non-local connections or long-range correlations and are visualised to
result from the superimposition of a continuum of eddies. Therefore, by
analogy, the observed fractal fluctuations of frequency distribution
of bases A, C, G, T exhibit quantumlike chaos in the Drosophila DNA
base sequence structure.
Incidentally
physics at the atomic scale is determined by the rules of quantum mechanics,
which tells us that particles propagate like waves, and so can be described
by a quantum mechanical wave function (Rae, 1999). As an immediate consequence,
a particle can be in two or more states at the same time - a so-called
superposition of states. This curious behaviour has been hugely successful
in describing physical systems at the microscopic level. For example, under
the rules of quantum mechanics two atoms sharing an electron form a chemical
bond, whereas in classical theory the electron remains confined to one
atom and the bond cannot form (Blatter, 2000).
(2) Berry's phase, namely, phase spectra
and variance spectra being the same is seen in about 50% of
the data sets (Figure 9). However, for all the data sets, the phase spectra
follow the variance spectra for a majority of dominant wavebands (Figure
6), particularly for the shorter wavelengths up to 4 - 6 unit
block length of 50 bases. Microscopic scale quantum systems exhibit
Berry's
phase.
(3) The period T50 up to
which the cumulative percentage contribution to total variance is equal
to 50% is larger than the model predicted (Equation 7) value
equal to 3.6 unit block length of 50 bases for a majority
of data sets (Figure 9). This may indicate that the primary length scale
may be less than the unit block length of 50 bases used for evaluating
the frequency distribution.
(4) The power spectra exhibit dominant wavebands
with peak wavelengths close to model predicted values (Equation 2). The
average class interval-wise distribution of dominant wavelengths
(Figure 4) and dominant wavelengths which exhibit Berry's phase
(Figure 6) for all data sets show a maximum for the shorter wavelengths
up to 4 - 6 unit block length of 50 bases. The dominant significant
wavelengths show a maximum for wavelengths larger than 4 - 6 unit
block length of 50 bases. This result is consistent with observed
value of T50 being greater than the model predicted
value equal to 3.6 unit block length of 50 bases as shown
in item (3) above.
(5) The bandwidth of the dominant waveband
is directly proportional to the square of the corresponding peak wavelength
(Figure 7) in agreement with model prediction (Equation 9).
5. Conclusions
Power spectra of frequency distribution of
bases A, C, G, T of Drosophila DNA base sequence follow the model predicted
universal and unique inverse power law form of the statistical normal distribution.
Inverse power-law
form for power spectra generic to fractal fluctuations is a signature
of self-organized criticality in dynamical systems in nature. The
author had shown earlier (Selvam and Suvarna Fadnavis, 1998; Selvam 2001a,
b) that (a) self-organized criticality can be quantified in terms
of the universal inverse power-law form of the statistical normal distribution
and (b) self-organized criticality of selfsimilar fractal
fluctuations implies long-range space-time correlations and is a signature
of quantumlike chaos in macro-scale dynamical systems of all space-time
scales.
Inverse power-law form
for power spectra of fluctuations in spatial distribution of bases A, C,
G, T imply long-range spatial correlations, or in other words, persistence
or long-term (length scale) memory of short-term fluctuations. The fine
scale structure of longer length scale fluctuations carry the signature
of shorter length scale fluctuations. The cumulative integration of shorter
length scale fluctuations generates longer length scale fluctuations (eddy
continuum) with two-way ordered energy feedback between the fluctuations
of all length scales (Equation 1). The eddy continuum acts as a robust
unified whole fuzzy logic network with global response to local perturbations.
Increase in random noise or energy input into the short-length scale fluctuations
creates intensification of fluctuations of all other length scales in the
eddy continuum and may be noticed immediately in shorter length scale fluctuations.
Noise is therefore a precursor to signal.
Real world examples
of noise enhancing signal has been reported in electronic circuits (Brown,
1996). Man-made, urbanisation related, greenhouse gas induced global warming
(enhancement of small-scale fluctuations) is now held responsible for devastating
anomalous changes in regional and global weather and climate in recent
years (Selvam and Fadnavis, 1998). Noise and fluctuations are at the seat
of all physical phenomena. It is well known that, in linear systems, noise
plays a destructive role. However, an emerging paradigm for nonlinear systems
is that noise can play a constructive role—in some cases information transfer
can be optimized at nonzero noise levels. Another use of noise is that
its measured characteristics can tell us useful information about the system
itself. Problems associated with fluctuations have been studied since 1826
(Abbott, 2001).
The apparently irregular
fractal
fluctuations of the frequency distribution of bases A, C, G, T in Drosophila
DNA base sequence self-organize spontaneously to generate the robust geometry
of logarithmic spiral with the quasiperiodic
Penrose tiling pattern
for the internal structure. Conventional power spectral analyses resolves
such a logarithmic spiral geometry as an eddy continuum with embedded dominant
wavebands, the peak periodicities being functions of the golden mean
and the primary perturbation length scale equal to block length of 50
bases used in the present study. Power spectral analyses of the frequency
distribution of bases A, C, G, T in Drosophila DNA base sequence also exhibit
the model predicted dominant wavebands. These dominant periodicities are
intrinsic to the selfsimilar
fractal fluctuations (space-time) of
dynamical systems in nature. Quantum systems are also characterised by
continuous irregular space-time fluctuations analogous to fractal
fluctuations of macro-scale dynamical systems (Hey and Walters, 1989).
The quasicrystalline
structure of the quasiperiodic Penrose tiling pattern underlies
the apparently irregular distribution of the bases A, C, G, T in Drosophila
DNA base sequence. Historically, Schrodinger (1967) introduced a concept
that the most essential part of a living cell - the chromosome fibre -
may suitably called an aperiodic crystal (Gribbin, 1985). A periodic crystal,
like one of common salt, can carry only a very limited amount of information.
But an aperiodic crystal in which there is structure obeying certain fundamental
laws, but no dull repetition can carry enormous amount of information
(Gribbin, 1985). The space filling geometric figure of the Penrose
tiling pattern has intrinsic local five-fold symmetry (Devlin, 1997)
and also ten-fold symmetry. One of the three basic components of DNA, the
deoxyribose is a five-carbon sugar and may represent the local five-fold
symmetry of the quasicrystalline structure of the quasiperidic Penrose
tiling pattern of the DNA molecule as a whole. The DNA molecule also shows
tenfold symmetry in the arrangement of 10 bases per turn of the
double helix (Watson and Crick, 1953). The study of plant phyllotaxis in
botany shows that the quasicrystalline structure of the quasiperiodic Penrose
tiling pattern provides maximum packing efficiency for seeds, florets,
leaves, etc (Jean, 1994; Stewart, 1995; Mary Selvam, 1998). Quasicrystalline
structure of the quasiperiodic Penrose tiling pattern may
be the geometrical structure underlying the packing of 103
to 105 micrometer of DNA in a eukaryotic (higher organism)
chromosome into a metaphase structure a few microns long.
The important result
of the present study is that the observed fractal frequency distributions
of the bases A, C, G, T of Drosophila DNA base sequence exhibit long-range
spatial correlations or self-organized criticality generic to dynamical
systems in nature. Therefore, artificial modification of base sequence
structure at any location may have significant noticeable effect on the
function of the DNA molecule as a whole. Further, the presence of introns
may not be redundant, but may serve to organise the effective functioning
of the exons in the DNA molecule as a complete unit.
Acknowledgements
The author is grateful to Dr. A. S. R. Murty
for his keen interest and encouragement during the course of this study.
References
Abbott, D., 2001: Overview: Unsolved problems
of noise and fluctuations. Chaos 11(3), 526-538.
Alcamo, E., 2001: DNA Technology 2nd
Edition. Academic Press, New York, pp.339.
Allegrini, P., Barbi, M., Grigolini, P., and
West, B. J., 1996: Dynamical model for DNA sequences. Physical Review
E 52(5), 5281-5296. http://linkage.rockefeller.edu/wli/dna_corr
Anandan, J., 1992: The geometric phase. Nature
360, 307-313.
Arber, A.,1950: The Natural Philosophy
of Plant Form. Cambridge University Press, London.
Arneodo, A., Bacry, E., Graves, P. V. and
Muzy, J. F., 1995: Characterizing long-range correlations in DNA sequences
from wavelet analysis.
Physical Review Letters 74(16),
3293-3296. http://linkage.rockefeller.edu/wli/dna_corr/arneodo95.pdf
Arneodo, A., Muzy, J.-F., and Sornette, D.,
1998: ‘Direct’ causal cascade in the stock market. European Physical
J. B Vol. 2, 277-282.
Audit, B., Thermes, C., Vaillant, C., d’Aubenton-Carafa,
Y., Muzy, J. F. and Arneodo, A., 2001: Long-range correlations in genomic
DNA: A signature of the nucleosomal structure. Physical Review Letters
86(11), 2471-2474. http://linkage.rockefeller.edu/wli/dna_corr/audit01.pdf
Bak, P., Tang, C. Wiesenfeld, K., 1987: Self-organized
criticality : an explanation of 1/f noise. Phys. Rev. Lett. 59,
381-384.
Bak, P.C., Tang, C., Wiesenfeld, K., 1988:
Self-organized criticality. Phys. Rev. A. 38, 364 - 374.
Bak, P., Chen, K., 1989: The physics of fractals.
Physica
D 38, 5-12.
Bak, P., Chen, K., 1991: Self-organized criticality.
Sci.
Am. Jan., 26-33.
Bak, P., Chen, K., Scheinkman, J. A., and
Woodford, M., 1992: Self-organized criticality and fluctuations in economics.http://www.santafe.edu/sfi/publications/Abstracts/92-04-018abs.html
Ball, P. 2000: Augmenting the alphabet. Nature
Science Update 30 August.
Bates, A. D. and Maxwell, A., 1993: DNA
Topology. Oxford University Press, Oxford, pp.111.
Berry, M. V.,1988: The geometric phase.
Sci.
Amer. Dec., 26-32.
Blatter, G., 2000: Schrodinger's cat is now
fat. Nature 406, 25-26.
Brown, J.,1996: Where two worlds meet. New
Scientist 18 May, 26-30.
Buchanan, M.,1997: One law to rule them all.
New
Scientist 8 Nov., 30-35.
Buldyrev, S. V., Goldberger, A. L.,
Havlin, S., Mantegna, R. N., Matsa, M. E., Peng, C. K., Simons, M.
and Stanley, H. E., 1995: Long-range correlation properties of coding and
non-coding DNA sequences - GenBank analysis. Physical Review E 51(5),
5084-5091. http://linkage.rockefeller.edu/wli/dna_corr/buldyrev95.pdf
Burroughs, W. J.,1992: Weather Cycles:
Real or Imaginary? Cambridge University Press, Cambridge.
Canavero, F. G., Einaudi, F.,1987: Time and
space variability of atmospheric processes. J. Atmos. Sci. 44(12),1589-1604.
Capra, F., 1996:The web of life.
Harper Collins, London, pp.311.
Chatzidimitriou-Dreismann, C. A. and Larhammar,
D., 1993: (Scientific Correspondence), Nature 361,
212-213. http://linkage.rockefeller.edu/wli/dna_corr
Chen, P., 1996a: Trends, shocks, persistent
cycles in evolving economy - business cycle measurement in
time-frequency representation, The Chapter 13 in Nonlinear Dynamics
and Economics, W.A. Barnett, A.P. Kirman, and M. Salmon eds. , Cambridge
University Press, Cambridge, UK.
Chen, P., 1996b: A random walk or color chaos
on the stock market? time-frequency analysis of S&P Indexes. Studies
in Nonlinear Dynamics and Econometrics 1(2), 87-103. http://mitpress.mit.edu/e-journals/SNDE/001/articles/v1n2002.pdf
Claire, J., 1964: The stuff of life.
Phoenix House, London, pp.67.
Clark, A. G., 2001: The search for meaning
in noncoding DNA. Genome Research 11, 1319-1320. http://linkage.rockefeller.edu/wli/dna_corr
Deering, W., West, B. J., 1992: Fractal physiology.
IEEE
Engineering in Medicine and Biology, June, 40-46.
Devlin, K., 1997: Mathematics: The Science
of Patterns. Scientific American Library, NY, p.101.
Eatwell, J., Milgate, M., and Newman,
P., 1991: The New Palgrave: A Dictionary of Economics 3, MacMillan
Press, London.
Farmer, J. D., 1999: Physicists attempt
to scale the ivory towers of finance. Computing in Science
& Engineering November/December, 26-39. http://www.santafe.edu/sfi/publications/Abstracts/99-10-073abs.html
Feigenbaum, J. A., and Freund, P. G. O., 1997a:
Discrete scaling in stock markets before crashes.
http://xxx.lanl.gov/pdf/cond-mat/9509033
6 Sep 1995.
Feigenbaum, J. A., and Freund, P. G. O., 1997b:
Discrete scale invariance and the"second Black Monday".
http://xxx.lanl.gov/pdf/cond-mat/9710324
29 Oct 1997.
Feigenbaum, J. A., 2001a: A statistical analysis
of log-periodic precursors to financial crashes. http://xxx.lanl.gov/pdf/cond-mat/0101031
28 February 2001.
Feigenbaum, J. A., 2001b: More on a statistical
analysis of log-periodic precursors to financial crashes. http://xxx.lanl.gov/pdf/cond-mat/0107445
20 july 2001.
Freeman, G.R., 1987: Introduction. In: Freeman,
G.R. (ed.), Kinetics of Nonhomogenous Processes. John Wiley
and Sons, Inc., NY, pp. 1-18.
Freeman, G.R., 1990: KNP89: Kinetics of non
homogenous processes (KNP) and nonlinear dynamics. Can. J. Phys.
68,
655-659.
Ghashghaie, S., Breymann, Peinke, J., Talkner,
P., Dodge, Y., 1996: Turbulent cascades in foreign exchange markets.
Nature
381, 767-770.
Ghil, M.,1994: Cryothermodynamics: the chaotic
dynamics of paleoclimate. Physica D 77,130-159.
Gleick, J., 1987: Chaos : Making a New
Science. Viking , New York.
Goldberger, A. L., Rigney, D. R., West, B.
J., 1990: Chaos and fractals in human physiology. Sci. Am. 262(2),
42-49.
Gopikrishnan, P., Plerou, V., Amaral, L. A.
N., Meyer, M., Stanley, H. E., 1999: Scaling of the distribution of fluctuations
of financial market Indices.
http://xxx.lanl.gov/cond-mat/9905305.
Gribbin, J., 1985: In search of the double
helix. Wildwood House Ltd., England, pp.362.
Guharay, S., Hunt, B. R., Yorke, J. A., White,
O. R., 2000: Correlations in DNA sequences across the three domains of
life. Physica D 146 388-396. http://linkage.rockefeller.edu/wli/dna_corr/guharay00.pdf
Gutenberg, B., and Richter, R. F., 1944: Frequency
of earthquakes in California. Bull. Seis. Soc. Amer.
34,
185.
Hao Bailin, Lee, H. and Shuyu Zhang,S., 2000:
Fractals related to long DNA sequences and complete genomes. Chaos,
Solitons and Fractals 11(6), 825-836. http://linkage.rockefeller.edu/wli/dna_corr/haolee00.pdf
Havlin S., Buldyrev S. V., Goldberger, A.
L, Mantegna, R. N, Peng, C. K., Simons, M., Stanley, H. E., 1995: Statistical
and linguistic features of DNA sequences. Fractals Jun 3,
269-84.
Hey, T. and Walters, P., 1989: The Quantum
Universe. Cambridge University Press, Cambridge, pp.180.
Holste, D., Grosse, I. and Herzel,
H., 2001: Statistical analysis of the DNA sequence of human chromosome
22. Physical Review E 64, 041917(1-9). http://linkage.rockefeller.edu/wli/dna_corr/holste01.pdf
Hooge, C., Lovejoy, S., Schertzer, D., Pecknold,
S., Malouin, J. F., Schmitt, F., 1994: Multifractal phase transitions:
the origin of self-organized criticality in earthquakes. Nonlinear Processes
in Geophysics 1,191-197.
Jenkinson, A. F.,1977: A Powerful Elementary
Method of Spectral Analysis for use with Monthly,Seasonal or Annual Meteorological
Time Series. Meteorological Office, London, Branch Memorandum No. 57,
pp. 1-23.
Jean R. V. 1994. Phyllotaxis : A Systemic
Study in Plant Morphogenesis, Cambridge University Press, NY, USA.
Kadanoff, L. P., 1996: Turbulent excursions.
Nature
382, 116-117.
Kane, R. P., 1996: Quasibiennial and quasitriennial
oscillations in some atmospheric parameters. PAGEOPH 147(3),
567-583.
Kolmogorov, A. N.,1941: The local structure
of turbulence in incompressible liquids for very high Reynolds numbers.
C.
R. Russ. Acad. Sci., 30, 301-305.
Kolmogorov, A. N.,1962: A refinement of previous
hypotheses concerning the local structure of turbulence in a viscous inhomogeneous
fluid at high Reynolds number. J. Fluid Mech. 13, 82-85.
Levine, D., Steinhardt, J., 1984: Quasicrystals
: A new class of ordered structures. Phys.Rev.Letts. 53(26),
2477-2480.
Leone, F., 1992: Genetics: the mystery
and the promise. TAB Books, McGraw Hill, Inc., pp.229.
Li, W., 1992: Generating nontrivial
long-range correlations and 1/f spectra by replication and mutation. International
Journal of Bifurcation and Chaos 2(1),137-154. http://linkage.rockefeller.edu/wli/dna_corr/l-ijbc92-l.html
Li, W., and Kaneko, K., 1992: Long-range
correlation and partial 1/fa
spectrum in a noncoding DNA sequence. Europhysics Letters 17(7),
655-660. http://linkage.rockefeller.edu/wli/dna_corr/l-epl92-lk.html
Li, W., Marr, T. G., Kaneko, K.,
1994: Understanding long-range correlations in DNA sequences. Physica
D 75(1-3), 392-416; erratum: 82, 217 (1995). http://arxiv.org/chao-dyn/9403002
Maddox, J., 1988a: Licence to slang Copenhagen
? Nature 332, 581.
Maddox, J., 1988b: Turning phases into frequencies.
Nature
334, 99.
Maddox, J., 1993: Can quantum theory be understood
? Nature 361, 493.
Mandelbrot, B. B., 1975: On the geometry of
homogenous turbulence with stress on the fractal dimension of the iso-surfaces
of scalars. J. Fluid Mech. 72, 401-416.
Mandelbrot, B. B., 1977: Fractals: Form,
Chance and Dimension. Freeman, San Francisco.
Mantegna, R. N., Stanley, H. E.,1995: Scaling
behaviour in the dynamics of an economic index. Nature 376,
46-49.
Mary Selvam, A., 1990: Deterministic chaos,
fractals and quantumlike mechanics in atmospheric flows. Canadian J.
Physics 68, 831-841. http://xxx.lanl.gov/html/physics/0010046
Mary Selvam, A., Pethkar, J. S., and Kulkarni,
M. K., 1992: Signatures of a universal spectrum for atmospheric interannual
variability in rainfall time series over the Indian Region. Int'l J.
Climatol. 12, 137-152.
Mary Selvam, A., 1998: Quasicrystalline pattern
formation in fluid substrates and phyllotaxis. In "Symmetry in Plants",
D. Barabe and R. V. Jean (Editors), World Scientific Series in Mathematical
Biology and Medicine, Volume 4., Singapore, pp.795-809. http://xxx.lanl.gov/abs/chao-dyn/9806001
Mohanty, A. K. and Narayana Rao, A. V. S.
S., 2000: Factorial moments analyses show a characteristic length
scale in DNA sequences. Physical Review Letters 84(8),
1832-1835. http://linkage.rockefeller.edu/wli/dna_corr/mohanty00.pdf
Monin, A. S. Yaglom, A. M., 1975: Statistical
Hydrodynamics, Vols. 1 and 2. MIT Press, Cambridge, Ma.
Muller, A., Beugholt, C.,1996: The medium
is the message. Nature 383, 296-297.
Nelson, D. R., 1986: Quasicrystals. Sci.
Amer. 255, 42-51.
Newman, M., 2000: The power of design.
Nature
405,
412-413.
Omori, F., 1895: On the aftershocks of earthquakes.
J.
Coll. Sci., 7, 111.
Peng, C.-K., Buldyrev, S.V., Goldberger, A.
L., Havlin, S., Sciortino, F., Simons, M., and Stanley, H.E., 1992: Long-range
correlations in nucleotide sequences. Nature 356,168–170.
http://linkage.rockefeller.edu/wli/dna_corr/l-nature92-p.html
Plerou, V., Gopikrishnan, P., Amaral, L. A.
L., Meyer, M., Stanley, H. E., 1999: Scaling of the distribution
of price fluctuations of individual companies. http://xxx.lanl.gov/cond-mat/9907161.
Prabhu, V. V. and Claverie, J. M., 1992: Correlations
in intronless DNA (Scientific Correspondence). Nature 359,
782. http://linkage.rockefeller.edu/wli/dna_corr
Rae, A., 1988: Quantum-physics: illusion
or reality ? Cambridge University Press, New York, pp.129.
Rae, A. I. M., 1999: Waves, particles and
fullerenes. Nature 401, 651-653.
Richardson, L. F., 1960: The problem of contiguity:
an appendix to statistics of deadly quarrels. In: Von Bertalanffy, L.,
Rapoport, A.,(eds.) General Systems - Year book of the society for general
systems research, V, pp 139-187, Ann Arbor, MI.
Richardson, L. F.,1965: Weather Prediction
by Numerical Process. Dover, Mineola, N.Y.
Ruhla, C. 1992: The Physics of Chance
. Oxford University Press, Oxford, pp.217.
Sambamurty, A. V. S. S., 1999: Genetics.
Narosa Publishing House, New Delhi, 1999, pp.757.
Schrodinger, E., 1967: What is Life?
Cambridge University Press, Cambridge.
Schroeder, M., 1991: Fractals , Chaos and
Powerlaws. W. H. Freeman and Co., N.Y.
Selvam, A. M., and Joshi, R. R.,1995: Universal
spectrum for interannual variability in COADS global air and sea surface
temperatures. Int'l. J. Climatol. 15, 613–623.
Selvam, A. M., Pethkar, J. S., Kulkarni, M.
K., and Vijayakumar, K., 1996: Signatures of a universal spectrum for atmospheric
interannual variability in COADS surface pressure time series.
Int'l.
J. Climatol. 16, 393-404.
Selvam, A. M., and Fadnavis, S.,1998:
Signatures of a universal spectrum for atmospheric interannual variability
in some disparate climatic regimes. Meteorology and Atmospheric Physics
66, 87-112. http://xxx.lanl.gov/abs/chao-dyn/9805028
Selvam, A. M., and Suvarna Fadnavis, 1998:
Cantorian fractal patterns, quantumlike chaos and prime numbers in atmospheric
flows. Chaos, Solitons and Fractals (Submitted). http://xxx.lanl.gov/abs/chao-dyn/9810011
Selvam, A. M., 2001a: Quantumlike chaos in
prime number distribution and in turbulent fluid flows. http://xxx.lanl.gov/html/physics/0005067
Published with modification in the Canadian electronic journal APEIRON
8(3), 29-64. http://redshift.vif.com/JournalFiles/V08NO3PDF/V08N3SEL.PDF
Selvam, A. M., 2001b: Signatures of
quantumlike chaos in spacing intervals of non-trivial Riemann zeta zeros
and in turbulent fluid flows. http://xxx.lanl.gov/html/physics/0102028
Published with modification in the Canadian electronic journal APEIRON
8(4), 10-40. http://redshift.vif.com/JournalFiles/V08NO4PDF/V08N4SEL.PDF
Simon, R., Kimble, H. J., Sudarshan, E. C.
G., 1988: Evolving geometric phase and its dynamical interpretation as
a frequency shift: an optical experiment. Phys. Rev. Letts. 61(1),19-22.
Skinner, J. E., 1994: Low dimensional chaos
in biological systems. Bio/technology 12, 596-600.
Som, A., Chattopadhyay, Chakrabarti, J. and
Bandyopadhyay, D., 2001: Codon distributions in DNA. Physical Review
E 63, 1-8. http://linkage.rockefeller.edu/wli/dna_corr/som01.pdf
Sornette, D., Johansen, A., and Bouchaud,
J-P., 1995: Stock market crashes, precursors and replicas.
http://xxx.lanl.gov/pdf/cond-mat/9510036
6 Oct 1995.
Stanley, H. E., 1995: Powerlaws and universality.
Nature
378, 554.
Stanley, M. H. R., Amaral, L. A. N., Buldyrev,
S. V., Havlin, S., Leschhorn, H. Maass, P., Salinger, M. A., Stanley H.E.,
1996: Can statistical physics contribute to the science of economics? Fractals
4(3), 415-425.
Stanley, H. E., Amaral, L. A. N., Buldyrev,
S. V., Goldberger, A. L., Havlin, S., Hyman, B. T., Leschhorn, H., Maass,
P., Makse, H. A., Peng, C.-K., Salinger, M. A., Stanley, M. H. R., Vishwanathan,
G. M., 1996:Scaling and universality in living systems. Fractals
4(3), 427-451.
Stanley, H. E., Afanasyev, V., Amaral,
L. A. N., Buldyrev, S. V., Goldberger, A. L., Havlin, S.,
Leschhorn, H., Maass, P., Mantegna, R. N., Peng, C.-K.,
Prince, P. A., Salinger, M. A., Stanley, M. H. R., and Viswanathanan,
G. M., 1996: Anomalous fluctuations in the dynamics of complex systems:
from DNA and physiology to econophysics. Physica A: Statistical and
Theoretical Physics 224(1-2), 302-321.
Stanley, H. E., 2000: Exotic statistical physics:
Applications to biology, medicine, and economics. Physica A 285,
1-17.
Stanley H. E., Amaral, L. A. N., Gopikrishnan,
P., and Plerou, V., 2000: Scale invariance and universality of economic
fluctuations. Physica 283 A, 31-41.
Stewart, I., 1992: Where do nature’s patterns
come from ? New Scientist 135, 14.
Stewart, I., 1995: Daisy, daisy, give your
answer do. Sci. Amer. 272, 76-79.
Thompson, D. W., 1963: On Growth and Form.
2nd Ed., Cambridge University Press.
Voss, R., 1992: Evolution of long-range fractal
correlations and 1/f noise in DNA base sequences. Physical Review Letters
68(25), 3805-3808.
Voss, R. F., 1994: Long-range fractal correlations
in DNA introns and exons. Fractals 2(1),1-6.
Wallace, J. M., Hobbs, P.V.,1977: Atmospheric
Science: An Introductory Survey. Academic Press, N. Y.
Watson, J. D. and Crick, F. H. C., 1953: A
structure for deoxyribose nucleid acid. Nature April 25,
737-38.
Watson, J. D., 1997: The double helix.
Weidenfeld and Nicolson, London, pp.175.
West, B. J., 1990a: Fractal forms in physiology.
Int’l.
J. Modern Physics B 4(10), 1629-1669.
West, B. J., 1990b: Physiology in fractal
dimensions. Annals of Biomedical Engineering 18, 135-149.
Yu, Z-G., Anh, V. V. and Wang, B., 2000: Correlation
property of length sequences based on global structure of the complete
genome. Physical Review E 63, 011903(1-8). http://linkage.rockefeller.edu/wli/dna_corr/yu00.pdf